Debugging & Performance Tools
XenoAtom.Terminal.UI includes built-in diagnostics to help you understand when and why the UI updates, and how much work each frame performs.
Debug overlay (F12)
In fullscreen apps (Terminal.Run(...)) and inline/live hosts (Terminal.Live(...)), press F12 to toggle the debug
overlay.
The gesture is configurable via TerminalAppOptions.ToggleDebugOverlayGesture (default: F12).
Keep the overlay enabled while developing dynamic UIs. It makes “silent” performance bugs obvious (for example: a control constantly re-measuring due to an unstable binding).
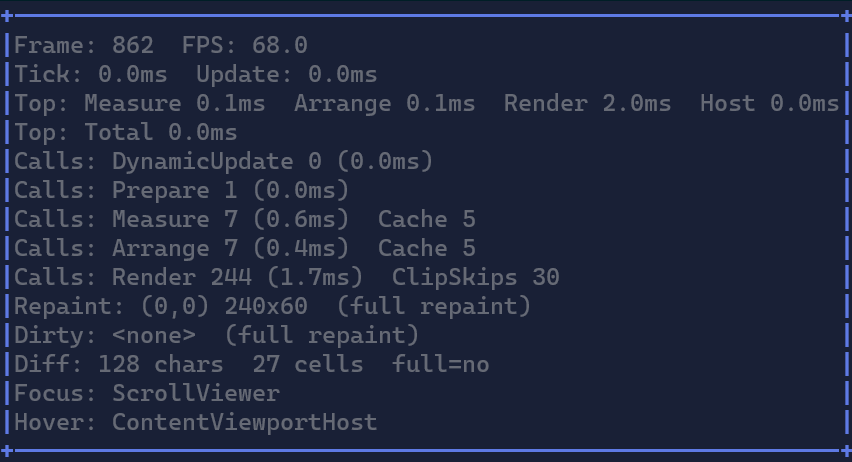
What the overlay shows
Frame and FPS
Frame: monotonically increasing render frame index.FPS: frames per second (computed from the time between frames).
If FPS is low, use the timing lines below to see which stage is expensive.
Tick and Update
Tick: total time spent in the app loop for the tick.Update: time spent in the useronUpdatecallback (your code).
If Update is high, you’re likely doing too much work in your update loop (I/O, allocations, heavy computations).
Top timings
These are top-level timings for the render pipeline:
Measure: total time spent measuring the visual tree.Arrange: total time spent arranging the visual tree.Render: total time spent rendering the visual tree into theCellBuffer.Overlay: time spent composing the debug overlay on top of the scene buffer.Host: time spent diffing + writing output to the terminal.Total: total render frame time.
Calls and caches
These lines show how many times each stage ran across all visuals in the frame:
Calls: DynamicUpdate: how often visuals rebuilt internal children/models.Calls: Prepare: how oftenPrepareChildrenran.Calls: Measure: how many visuals were measured.Calls: Arrange: how many visuals were arranged.Calls: Render: how many visuals executedRenderOverride.
Cache counters indicate how many times the framework reused a previous result:
Cache(Measure/Arrange): cache hits for layout.ClipSkips: render calls skipped because the visual was fully clipped.
If Measure/Arrange calls are high every frame, it often means:
- you are changing bindable state every frame (even when values don’t really change), or
- a control is reading state in a way that prevents caching (unstable dependencies).
Scene repaint and dirty rectangles
Scene: Repaint: the region of the real UI scene that the app chose to repaint for this frame.Scene: Dirty: the union of scene dirty rectangles reported during the frame.Scene: Full yes/no: whether the scene renderer used a full repaint.Scene: Last ... ago: the most recent scene repaint/dirty/full snapshot, kept visible after the app returns to idle.
When the overlay is the only thing updating, the scene lines stay at <none> / no. This is intentional: the overlay
is composed in a separate pass so it does not distort scene repaint diagnostics. The Scene: Last ... ago line is the
sticky context that lets you see what changed recently even after the current frame has already gone back to idle.
Overlay composition
Overlay: (x,y) wxh: the overlay rectangle on the composed frame.overlay-only: shown when the scene did not repaint and only the overlay was updated.
The overlay timing is reported separately so you can leave it on without confusing scene metrics.
Host diff output
HostDiff: N chars: how many output characters the host diff renderer wrote to the terminal.HostDiff: N cells: how many cells changed compared to the previous composed buffer.full=yes/no: whether the diff renderer forced a full redraw.
These numbers include overlay changes because they describe what the host actually wrote to the terminal.
If HostDiff is consistently high, you are rewriting many cells each frame (large animated regions, blinking cursors,
etc.).
Focus and Hover
Shows the current focused and hovered visual type names. This is useful when debugging input routing and focus scopes.
Using the overlay to optimize
Symptom: constant Measure/Arrange every frame
Likely causes:
- some bindable property is changing each frame (even if it changes back), or
- a control reads and writes the same bindable state in one pass and triggers extra invalidations.
Start by:
- Locate the region that animates/changes.
- Check which stage is expensive (Measure/Arrange/Render).
- Temporarily hide/disable parts of the tree to isolate the culprit.
Symptom: high Render but low Diff
This usually means you are spending time rendering clipped or unchanged regions. Look at ClipSkips, and consider:
- reducing visual tree size,
- avoiding per-cell loops outside the clipped region,
- using virtualization (
DataGridControl,LogControl) for large datasets.